UserOps
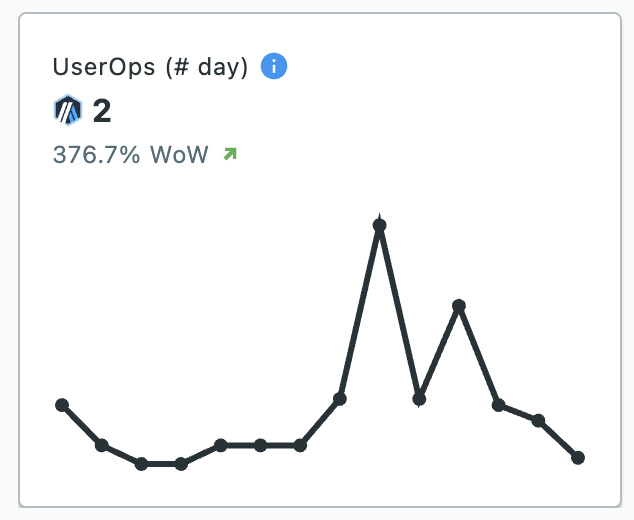
The User Op Chart shows the number of UserOps created on the selected chain for the last 14 days.
It also shows the % change in total number of ops last 7 days vs the 7 days before that.

The User Op Chart shows the number of UserOps created on the selected chain for the last 14 days.
It also shows the % change in total number of ops last 7 days vs the 7 days before that.
